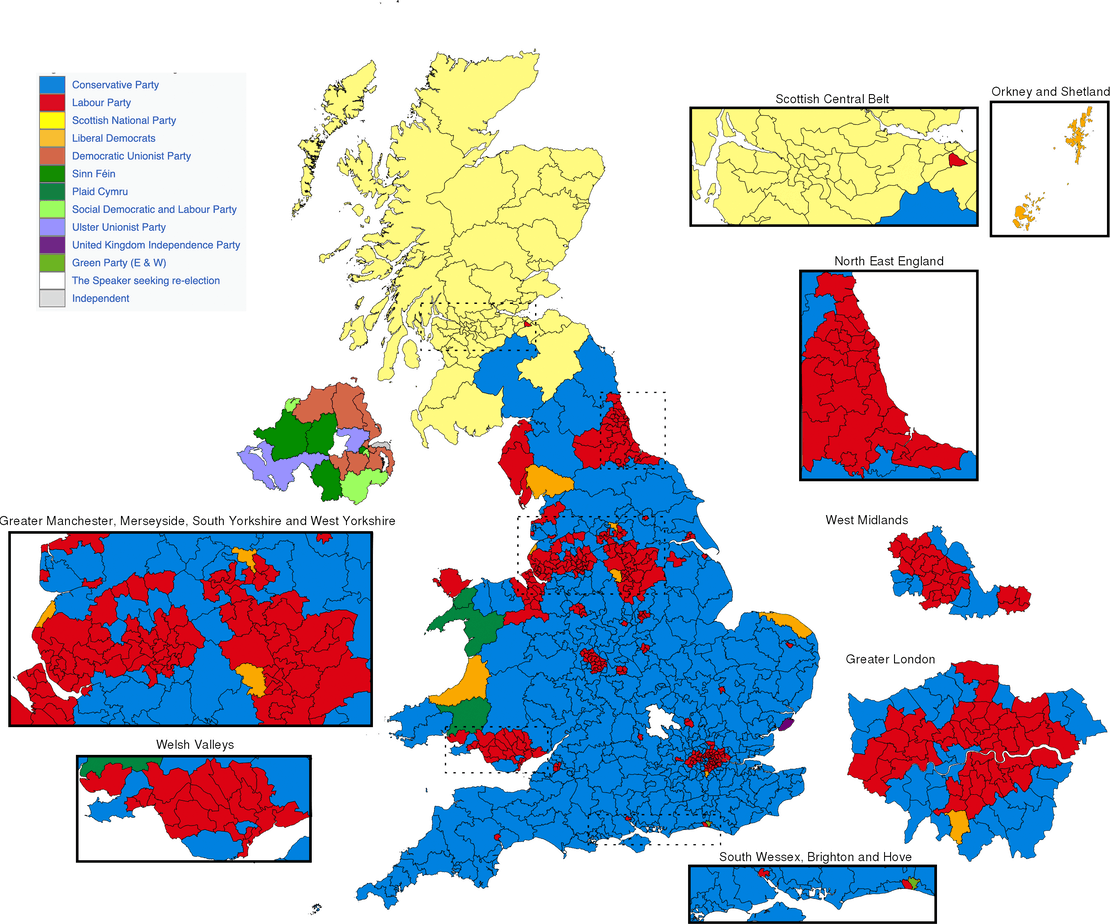
The map above shows the results of the 2015 UK General Election. The number of seats won out of 650 by the major parties (and % vote share) were as follows:
Conservatives: 330. Leader and Prime Minister: David Cameron.
Labour: 232. Leader: Ed Miliband.
Scottish National Party: 56. Leader: Nicola Sturgeon.
Liberal Democrats: 8. Leader: Nick Clegg.
Notable things about the 2015 election include:
- David Cameron beat expectations and won a small majority, despite much talk of potential coalition deals in the run-up to polling day.
- What added to the surprise was that Labour held a polling lead almost until election day.
- The SNP won an incredible 56 of the 59 seats in Scotland, off the back of an electorate galvanised by the 2014 independence referendum.
- The biggest losers of election night were the Liberal Democrats, which lost 49 seats. The vote was squeezed by coalition supporters going to the Conservatives, and opponents punishing the parties for keeping David Cameron in power.
- One awkward butterfly effect was that by winning a full majority, David Cameron was forced to placate his backbenchers and fulfil a pledge to hold a referendum on Britain’s EU membership. It didn’t turn out well.
- The campaign was the second with televised leaders debates. Because of the scrambled political landscape after coalition, this time around the debate was between the leaders of the seven largest parties in Westminster.
Other Elections:
Find this map interesting? Then please share.
Leave a Reply