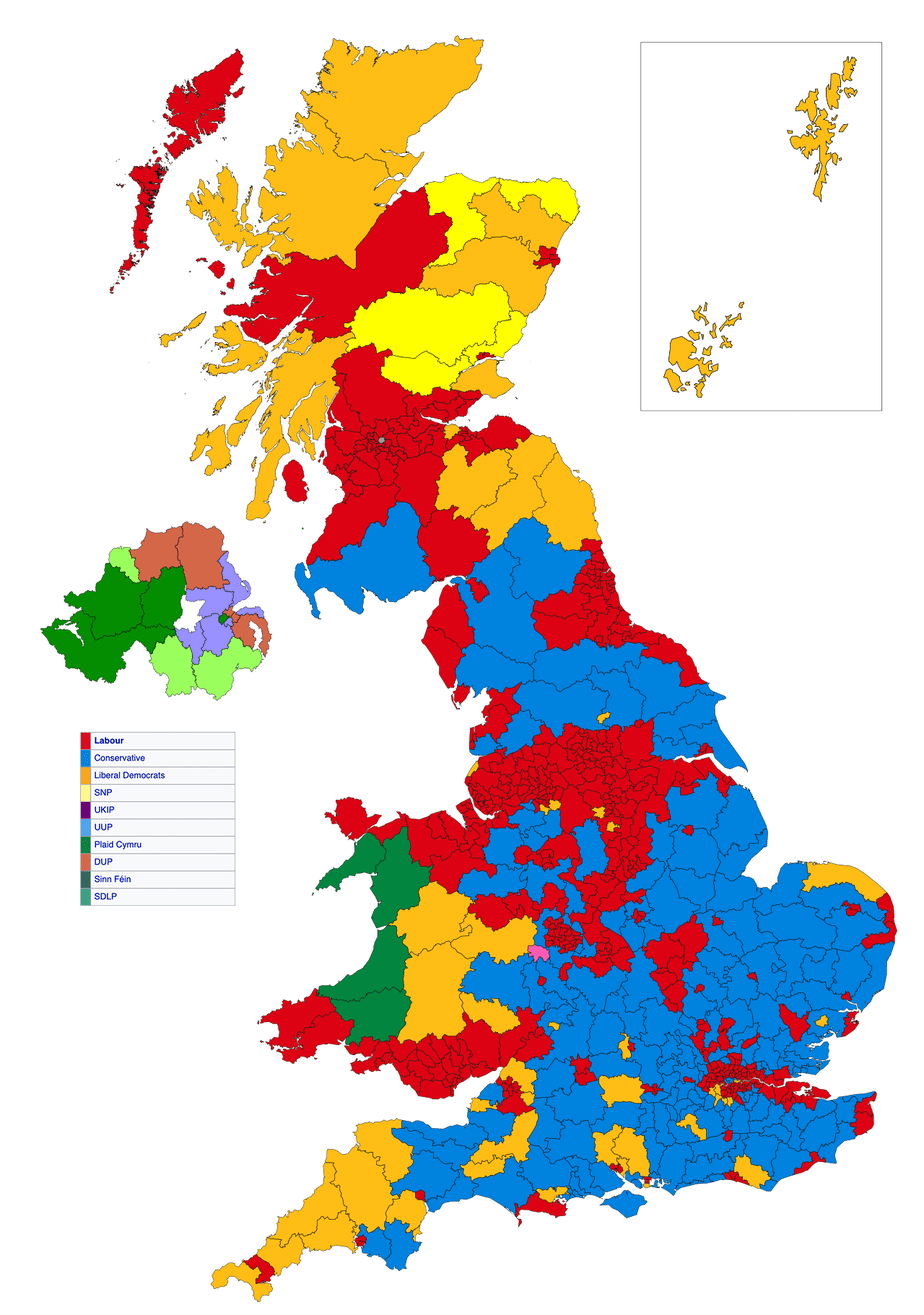
The map above shows the results of the 2001 UK General Election. The number of seats won out of 651 by the major parties (and % vote share) were as follows:
Labour: 413. Leader and Prime Minister: Tony Blair.
Conservatives: 166. Leader: William Hague.
Liberal Democrats: 52. Leader: Charles Kennedy.
Notable things about the 2001 election include:
- Look at those numbers! Despite having been in government for four years, Tony Blair was able to hold on to a majority of over 400. The Tories only managed to gain one seat. Crazy.
- The baseball cap was only partially to blame for Hague’s disastrous loss.
- The election had been planned to take place on May 3rd but was delayed until 7th June due to the foot & mouth disease crisis, which restricted movement around the country.
- This was the first election to have turnout below 60% since 1918.
- One of the biggest fractures in the Conservative Party around this time was Europe. This, umm, wouldn’t be the last time.
- Northern Ireland’s results were more polarised than before: Nationalists went for the more hardcore Sinn Fein, and Unionists tended to vote for the more hardcore DUP.
- Following the election there was much hubris about how the Liberal Democrats could conceivably supplant the Conservatives as the largest opposition party at the next election.
Other Elections:
- 1997 UK Election Map: The New Labour Revolution
- 2005 UK Election Map: Not Even The Iraq War Can Stop Tony Blair
Find this map interesting? Then please share.
Leave a Reply